Nginx 502 Upstream Triage
← Back to ASE ProjectsI simulated a customer-facing outage by misconfiguring the Nginx upstream (pointing to app:9999 instead of app:5000). The goal was to practice ticket-ready triage: reproduce the 502 with curl, see the impact in Grafana, use Loki logs to pinpoint the upstream issue, fix proxy_pass, and verify recovery—then summarize everything in a short runbook.
Stack
Docker Compose • Nginx • Flask • Postgres • Loki/Promtail • Grafana
What I Did
- Injected an upstream misconfig to force 502s
- Confirmed failures using
curland Grafana panels - Used Loki logs to find
connect() failed (111: Connection refused)on/api/users - Reverted
proxy_passand verified 200 OK - Documented a simple Nginx 502 troubleshooting flow
Incident Timeline
- Baseline: /api/users healthy behind Nginx
- Change: upstream updated to
app:9999 - Impact: 502s and Nginx 5xx/min spike
- Evidence: logs show upstream
connect() failed - Fix: restore upstream to
app:5000 - Recovery: 200 OK, 5xx back to 0
Incident Response Story
1) Introduce Misconfig & Reproduce 502
I intentionally pointed Nginx at the wrong upstream (app:9999) and hit /api/users through the proxy. This mimics a config change that breaks routing in production. As expected, curl returned 502 Bad Gateway, matching what a customer would report.
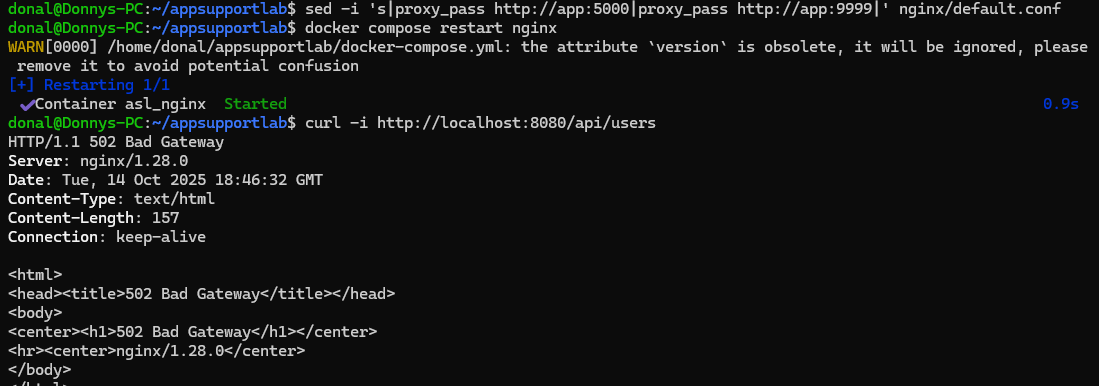
proxy_pass to http://app:9999, curl -i http://localhost:8080/api/users returns 502 Bad Gateway.2) Detect Impact in Metrics & Logs
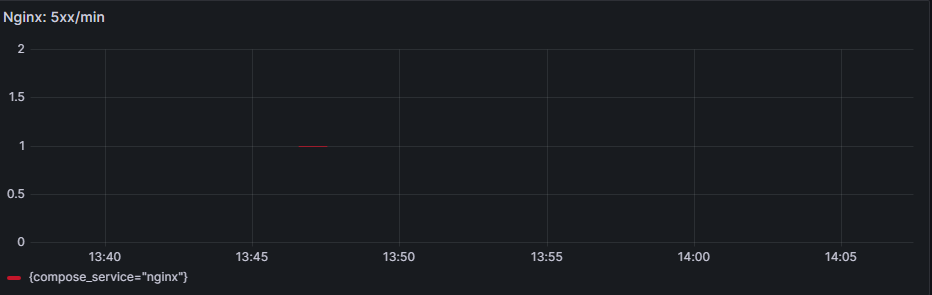
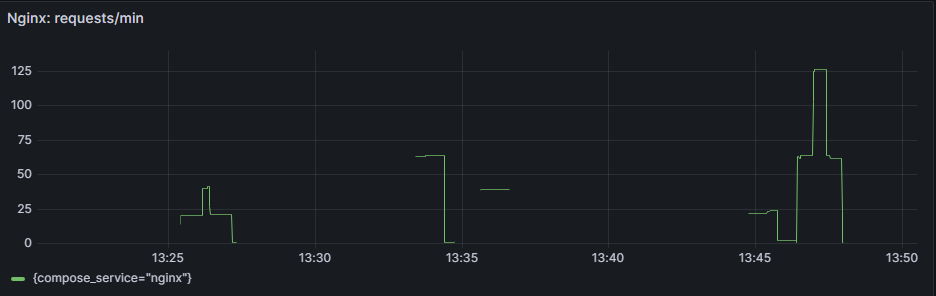
With the misconfig in place, I generated traffic and used Grafana to see the impact: Nginx 5xx/min spiked during the incident window, while Loki logs showed upstream connection failures on /api/users. This confirmed that the 502s were coming from Nginx, not the app or database.
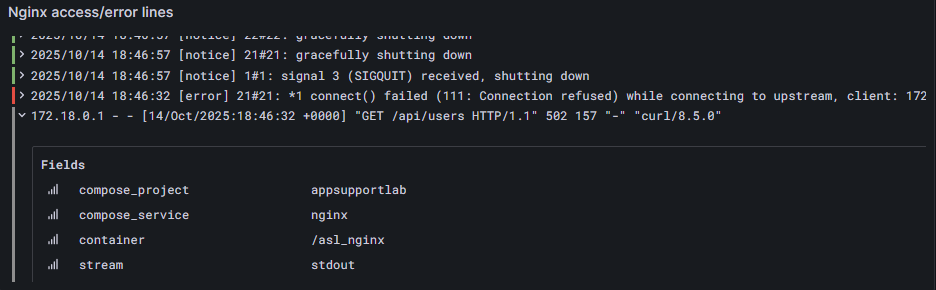
connect() failed (111: Connection refused) and 502 on /api/users, showing Nginx can't reach the upstream container.3) Fix Upstream & Verify Recovery
I restored proxy_pass back to http://app:5000, restarted Nginx, and re-ran the same curl checks. The endpoint returned 200 OK again, and 5xx counts dropped back to zero. Metrics and logs both showed a clean post-fix window.
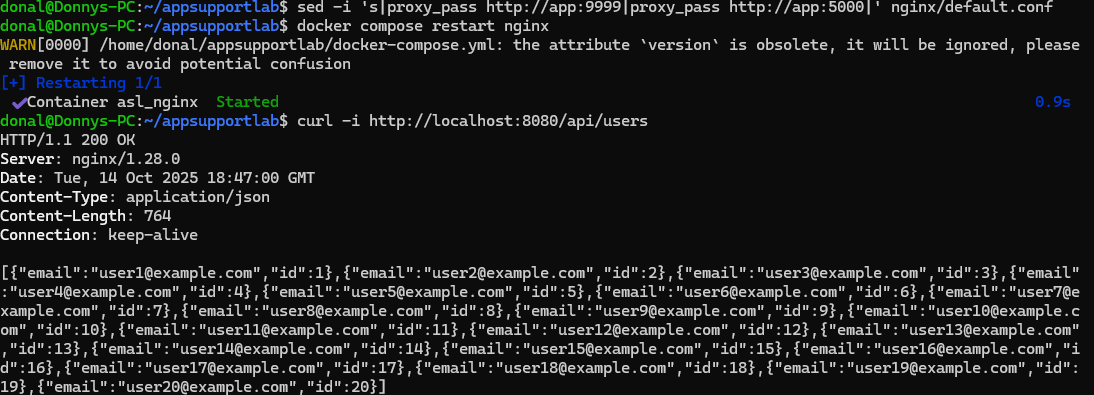
app:5000, curl -i http://localhost:8080/api/users returns 200 OK, confirming recovery.Key Commands Used
Shell
# Break it: misconfigure upstream and restart Nginx
sed -i 's|proxy_pass http://app:5000|proxy_pass http://app:9999|' nginx/default.conf
docker compose restart nginx
curl -i http://localhost:8080/api/users   # 502

# Fix it: restore upstream and restart Nginx
sed -i 's|proxy_pass http://app:9999|proxy_pass http://app:5000|' nginx/default.conf
docker compose restart nginx
curl -i http://localhost:8080/api/users   # 200
LogQL (Loki)
# Nginx requests/min
sum(count_over_time({compose_project="appsupportlab",compose_service="nginx"} [1m]))

# Nginx 5xx/min
sum(count_over_time({compose_project="appsupportlab",compose_service="nginx"} |~ " 5\\d\\d " [1m]))

# Logs selector for evidence (filter in Explore)
{compose_project="appsupportlab",compose_service="nginx"}
Outcome & Prevention
- Localized the outage to an Nginx upstream misconfiguration, not the app code or database layer.
- Practiced a repeatable pattern: reproduce with
curl→ check metrics → check logs → fix config → re-test. - Captured a lightweight runbook for Nginx 502s: verify
proxy_pass, look forconnect() failedin logs, and confirm recovery with a post-fix smoke test.