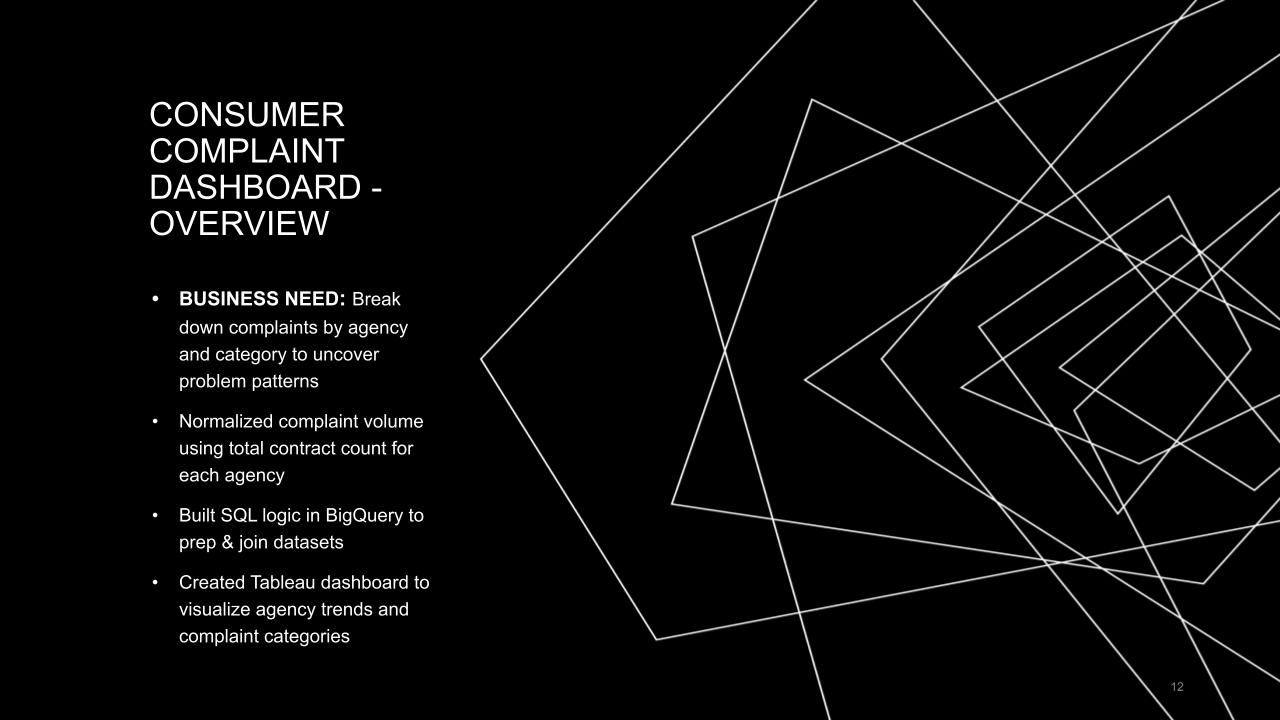
Consumer Complaint Dashboard
Interactive dashboard that analyzes consumer complaints by agency and category, with normalized metrics to enable fair comparisons regardless of agency size.
Key Features
- Normalized complaint volume using total contract count for fair agency comparison
- SQL joins and CTEs to combine complaint data with agency information
- Interactive Tableau dashboards with filtering capabilities
- Complaint reason breakdown to identify service issues
- Color formatting to highlight agencies with elevated complaint rates
Technologies Used
SQL (BigQuery)
Tableau
Data Visualization
KPI Development
Results
- Enabled fair comparison across agencies regardless of size
- Identified service breakdowns by complaint category and agency
- Improved SQL fluency through CTEs, joins, and row-ranking
- Created actionable insights for operational improvements
Dashboard Overview
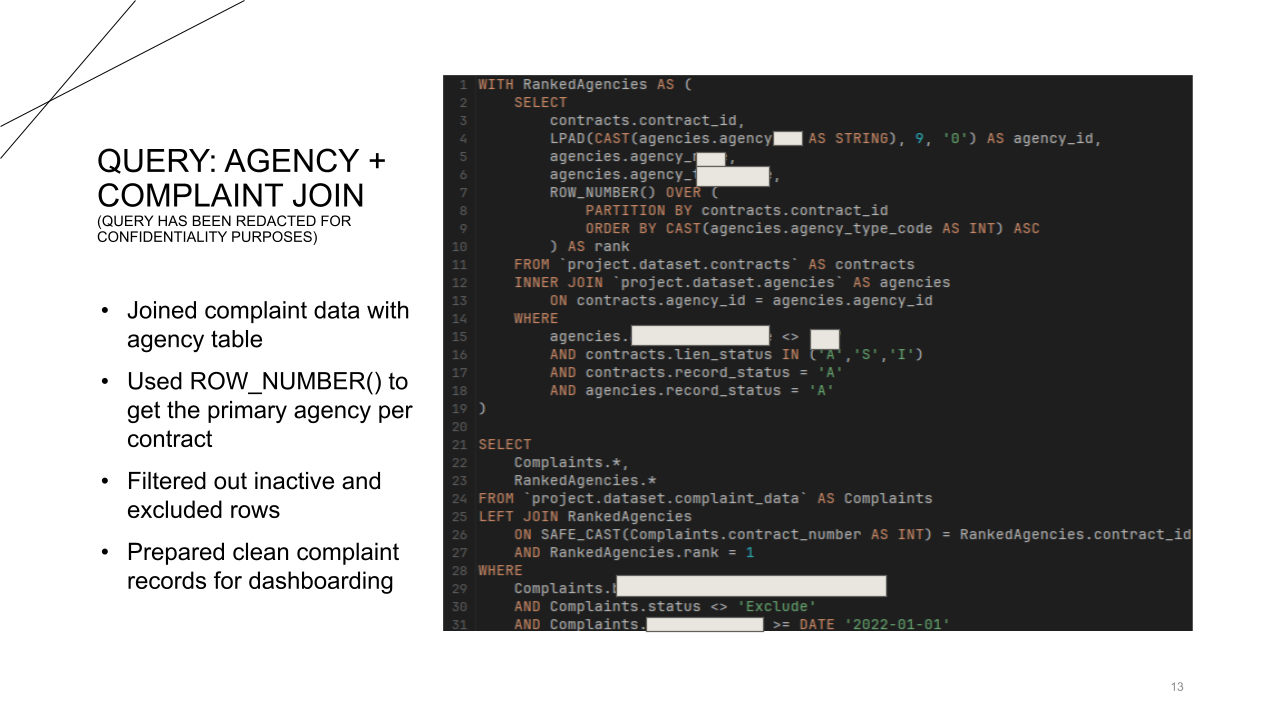
Agency Join Query
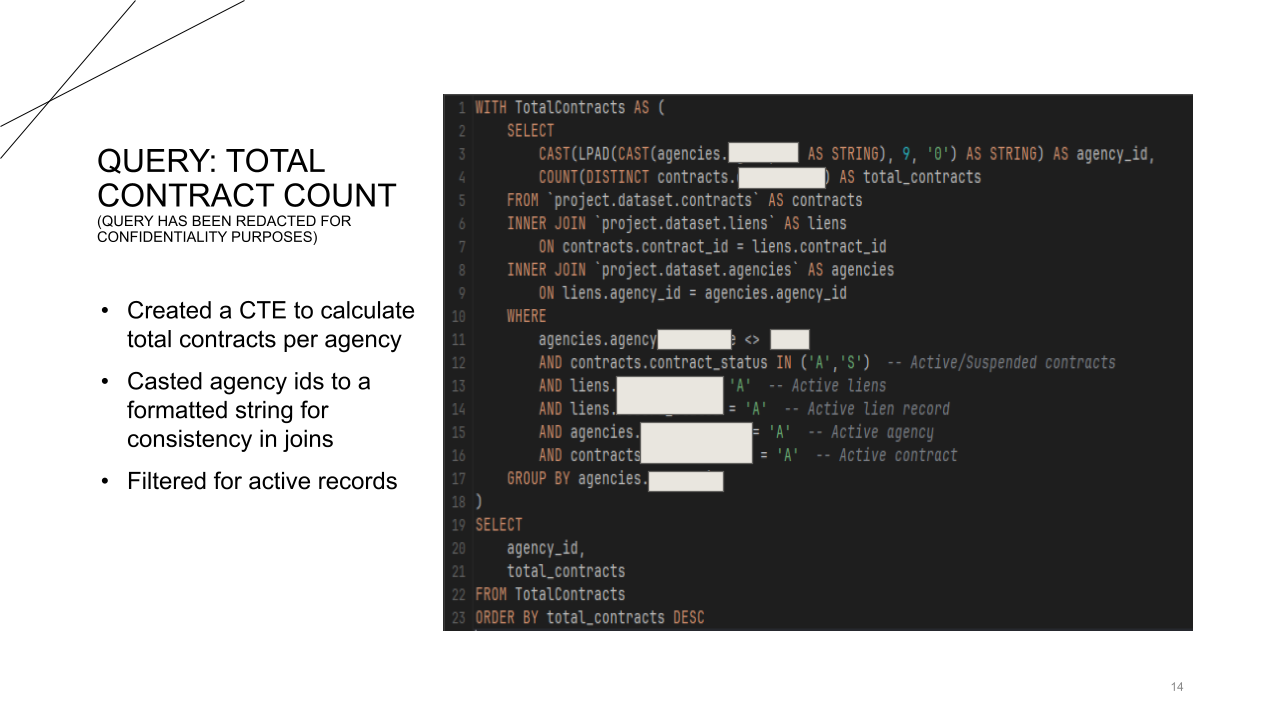
Total Contract Query
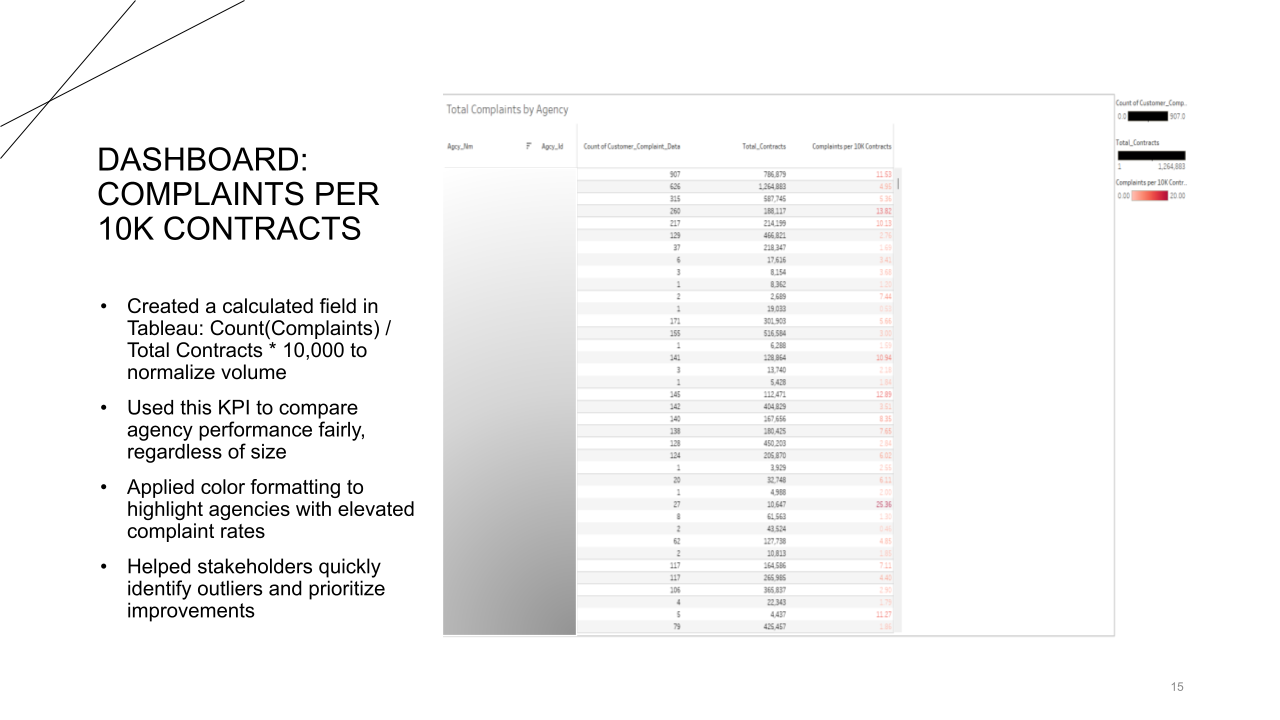
Complaints Per 10K Contracts
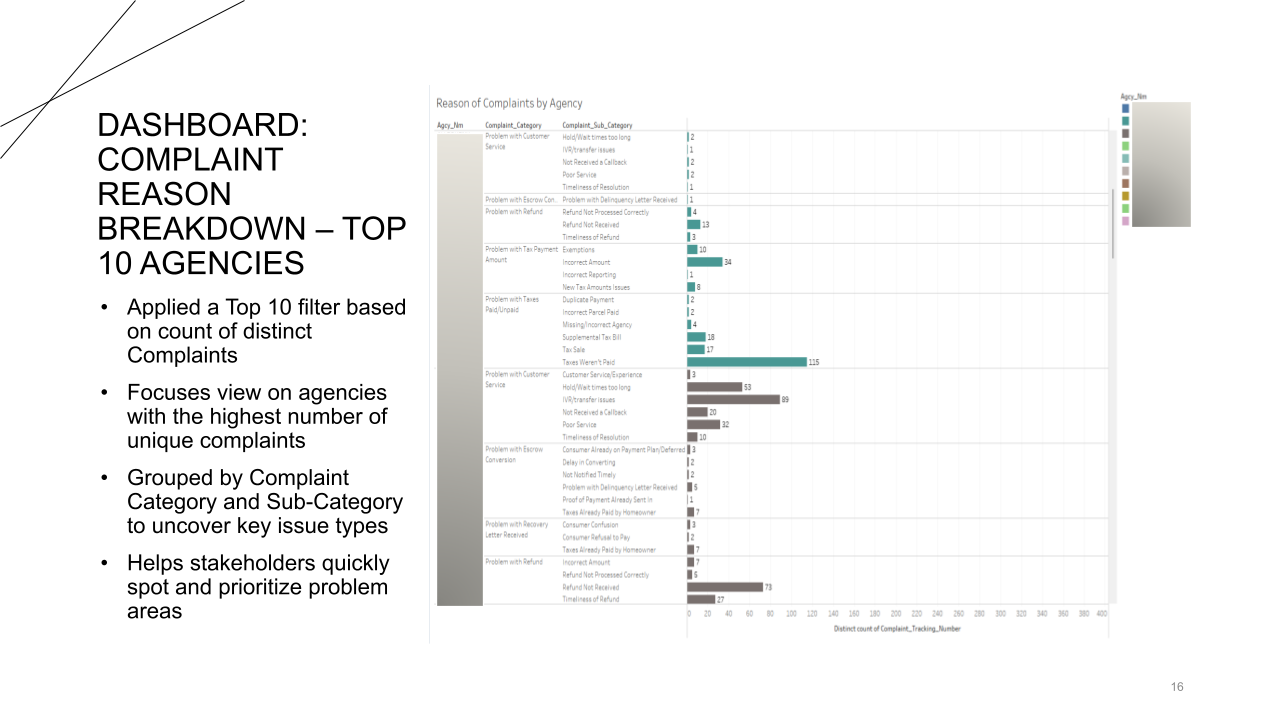
Complaint Reason Breakdown
Project Takeaways